Parrot OS · Volume 9
Parrot OS Volume 9 — Wireshark Part 2: Analysis, Decryption, tshark, Cross-OS Workflows
Protocol dissectors with worked examples, Follow Stream, TLS and WPA2 decryption, tshark scripting, the cross-OS pcap pipeline
9.1 Protocol dissectors — the heart of analysis
A dissector is a Wireshark module that takes raw bytes of a packet and recognizes “this is HTTP, that field is the User-Agent header, this is the URI, etc.” Wireshark ships ~3000 dissectors covering almost every protocol you’ll ever see — from Ethernet (essentially mandatory) to obscure SCADA / industrial-control protocols.
9.1.1 How dissection chains
Each packet flows through a chain. For a typical web request:
Ethernet → IPv4 → TCP → TLS → HTTP/2Each dissector identifies its layer, then hands the inner bytes to the next-layer dissector. Wireshark’s heuristic dissectors can also guess — if a TCP port is 8080 and the payload looks like HTTP, the HTTP dissector takes it even though the canonical HTTP port is 80.
You can manually force interpretation via Analyze → Decode As…. Useful when a service uses a non-standard port (an SSH server on TCP 2222, an HTTP API on 8443 that’s plain HTTP not HTTPS, an MQTT broker on 1884).
9.1.2 Enabled / disabled protocols
Some dissectors are noisy. The default Wireshark profile enables almost all of them. To turn off (e.g., suppress IPX dissection in a pure-IP environment): Analyze → Enabled Protocols → uncheck the protocol. Faster capture analysis, less clutter.
9.1.3 Adding custom Lua dissectors
For protocols Wireshark doesn’t know (proprietary, in-house, niche), you can write a dissector in Lua and drop it in ~/.config/wireshark/plugins/. The Wireshark wiki has a Lua dissector tutorial. Beyond the scope of this volume; mention here for completeness.
9.2 Worked examples — DNS, HTTP, TLS, WPA2 EAPOL, SSH, DHCP
For each protocol below: what the dissector shows you, the key fields you’d filter on, and the bug-hunting / pentest angle.
9.2.1 DNS
A DNS query looks like this in the details pane:
▶ Domain Name System (query)
    Transaction ID: 0x4a2f
    ▶ Flags: 0x0100 Standard query
    Questions: 1
    Answer RRs: 0
    Authority RRs: 0
    Additional RRs: 0
    ▶ Queries
        ▶ www.example.com: type A, class IN
            Name: www.example.com
            Type: A (Host Address) (1)
            Class: IN (0x0001)
The response from the resolver:
▶ Domain Name System (response)
    Transaction ID: 0x4a2f
    ▶ Flags: 0x8180 Standard query response, No error
    ▶ Queries
    ▶ Answers
        ▶ www.example.com: type A, class IN, addr 93.184.216.34
            Name: www.example.com
            Type: A
            Class: IN
            Time to live: 75
            Data length: 4
            Address: 93.184.216.34
Key filters:
dns.qry.name == "example.com"— specific querydns.qry.name contains "google"— substringdns.qry.type == 28— AAAA (IPv6) queriesdns.flags.response == 0— queries onlydns.flags.response == 1— responses onlydns.flags.rcode != 0— error responses (rcode 3 = NXDOMAIN)dns and udp.length > 512— DNS over UDP exceeding traditional limit (possible EDNS or amplification)
Pentest angle: DNS tunneling for exfiltration shows as anomalously large or frequent TXT-record queries to a controlled domain. dns.qry.type == 16 and frame.len > 200 is a quick triage filter.
9.2.2 HTTP
▶ Hypertext Transfer Protocol
    GET / HTTP/1.1\r\n
        Request Method: GET
        Request URI: /
        Request Version: HTTP/1.1
    Host: example.com\r\n
    User-Agent: Mozilla/5.0...\r\n
    Accept: text/html,...\r\n
    Cookie: session=abc123; preferences=dark\r\n
    \r\n
    [Full request URI: http://example.com/]
Key filters:
http.request— every HTTP requesthttp.response— every responsehttp.request.method == "POST"http.request.uri matches "/admin"http.user_agent contains "sqlmap"(catch attack tools)http.cookie contains "session"http.response.code >= 500— server errorshttp.host == "example.com"http.authorization— packets carrying HTTP basic-auth (look for base64-encoded creds)
Pentest angle: http.request and not http.host == "internal-cdn" filters out CDN traffic in an internal capture. http.authorization contains "Basic" finds clear-text basic-auth credentials.
9.2.3 TLS (Transport Layer Security)
The TLS handshake is the most-asked-about Wireshark thing. The dissector breaks it into:
▶ Transport Layer Security
    ▶ TLSv1.2 Record Layer: Handshake Protocol: Client Hello
        Content Type: Handshake (22)
        Version: TLS 1.0 (0x0301)
        Length: 245
        ▶ Handshake Protocol: Client Hello
            Handshake Type: Client Hello (1)
            Length: 241
            Version: TLS 1.2 (0x0303)
            Random: ...
            Session ID Length: 32
            Cipher Suites Length: 30
            ▶ Cipher Suites (15 suites)
                Cipher Suite: TLS_AES_128_GCM_SHA256 (0x1301)
                ...
            Compression Methods Length: 1
            Extensions Length: 162
            ▶ Extension: server_name
                Type: server_name (0)
                Length: 22
                ▶ Server Name Indication extension
                    Server Name list length: 20
                    Server Name Type: host_name (0)
                    Server Name length: 17
                    Server Name: www.example.com
Key filters:
tls.handshake.type == 1— Client Hellotls.handshake.type == 2— Server Hellotls.handshake.type == 11— Certificatetls.handshake.extensions_server_name == "example.com"— connecting to specific host (SNI; visible even without decryption)tls.record.version == 0x0303— TLS 1.2tls.record.version == 0x0304— TLS 1.3 (in TLS 1.3, much less is in the clear)tls.handshake.ciphersuite == 0x1301— TLS_AES_128_GCM_SHA256tls.alert_message.level == 2— fatal TLS alerts (connection-killing)
Pentest angle: The SNI field leaks the destination hostname even though the rest of the connection is encrypted. tls.handshake.extensions_server_name is the field to grep when you want to know “what site is this user visiting?” — only encrypted-SNI (ECH) hides it, and ECH is still uncommon in 2026.
9.2.4 WPA2 EAPOL handshake (4-way)
When a Wi-Fi client associates with a WPA2 network, four EAPOL frames pass between the client (supplicant) and AP (authenticator). Capturing the full 4-way handshake is the prerequisite for offline-cracking the PSK or decrypting the session (§ 8).
▶ IEEE 802.11 QoS Data, Flags: ........F.
▶ 802.1X Authentication
    Version: 802.1X-2010 (3)
    Type: Key (3)
    Length: 117
    ▶ Key Descriptor: EAPOL RSN Key (2)
        ...
        Key Information: 0x008a
            (Indicates message 1 of 4)
        Key Length: 16
        ▶ Replay Counter: 0x0000000000000001
        Key Nonce: 1234567890abcdef...    ← ANonce (from AP)
        Key IV: 0000000000000000000000000000000000000000
        WPA Key RSC: 0000000000000000
        WPA Key ID: 0000000000000000
        WPA Key MIC: 00000000000000000000000000000000  ← (zero in msg 1; set in 2, 3, 4)
        WPA Key Data Length: 0
Key filters:
eapol— every EAPOL framewlan.fc.type_subtype == 0x08— beaconswlan.fc.type_subtype == 0x04— probe requestswlan.fc.type_subtype == 0x0c— deauth (the classic Wi-Fi attack signature)wlan.bssid == 00:11:22:33:44:55— frames involving specific AP
Pentest angle: A captured 4-way handshake + the SSID + the passphrase = decryption (or hashcat-able hash file). Capture monitor-mode → filter eapol → save as standalone pcap → feed to hashcat (-m 22000) or aircrack-ng.
9.2.5 SSH
SSH is encrypted from the start, so most of an SSH session is opaque. What’s visible:
- Banner exchange (
SSH-2.0-OpenSSH_9.6) - Key exchange algorithms negotiated
- Public-key algorithm types
- Session traffic sizes / timing patterns
▶ SSH Protocol
    ▶ SSH Version 2
        Protocol: SSH-2.0-OpenSSH_9.6\r\n
After the banner, packets show as encrypted Encrypted packet blobs.
Key filters:
ssh.protocol contains "OpenSSH"— software fingerprinttcp.port == 22 and !ssh— TCP/22 packets Wireshark didn’t recognize as SSH (often: a non-SSH service on port 22, port knocking)
Pentest angle: SSH session timing is informative — sustained 100-200 byte packets typical of an interactive shell; large bursts = file transfer or paste. Timing-correlation attacks on SSH are an academic topic; in practice, SSH-on-the-wire mostly just confirms “an SSH session happened.”
9.2.6 DHCP (BOOTP)
A new device on the network broadcasts DHCP Discover, gets Offer, sends Request, gets Ack. Each message reveals client information.
▶ Dynamic Host Configuration Protocol (Discover)
    Message type: Boot Request (1)
    Hardware type: Ethernet (0x01)
    Hardware address length: 6
    Hops: 0
    Transaction ID: 0xa1b2c3d4
    Client IP address: 0.0.0.0
    Your (client) IP address: 0.0.0.0
    Next server IP address: 0.0.0.0
    Relay agent IP address: 0.0.0.0
    Client MAC address: 00:11:22:33:44:55 (Vendor: VMware, Inc)
    ...
    ▶ Option: (53) DHCP Message Type (Discover)
    ▶ Option: (12) Host Name = "parrot-t480"
    ▶ Option: (60) Vendor class identifier = "MSFT 5.0"
    ▶ Option: (55) Parameter Request List
Key filters:
dhcporbootpdhcp.option.dhcp == 1— Discoverdhcp.option.dhcp == 5— Ackdhcp.option.hostname contains "windows"dhcp.option.vendor_class_id— fingerprint device OS
Pentest angle: DHCP traffic is one of the easiest passive-fingerprinting tools. A device’s DHCP hostname + vendor-class-ID often identifies it (iPhone, Windows host, Linux machine, IoT camera) without any active probing.
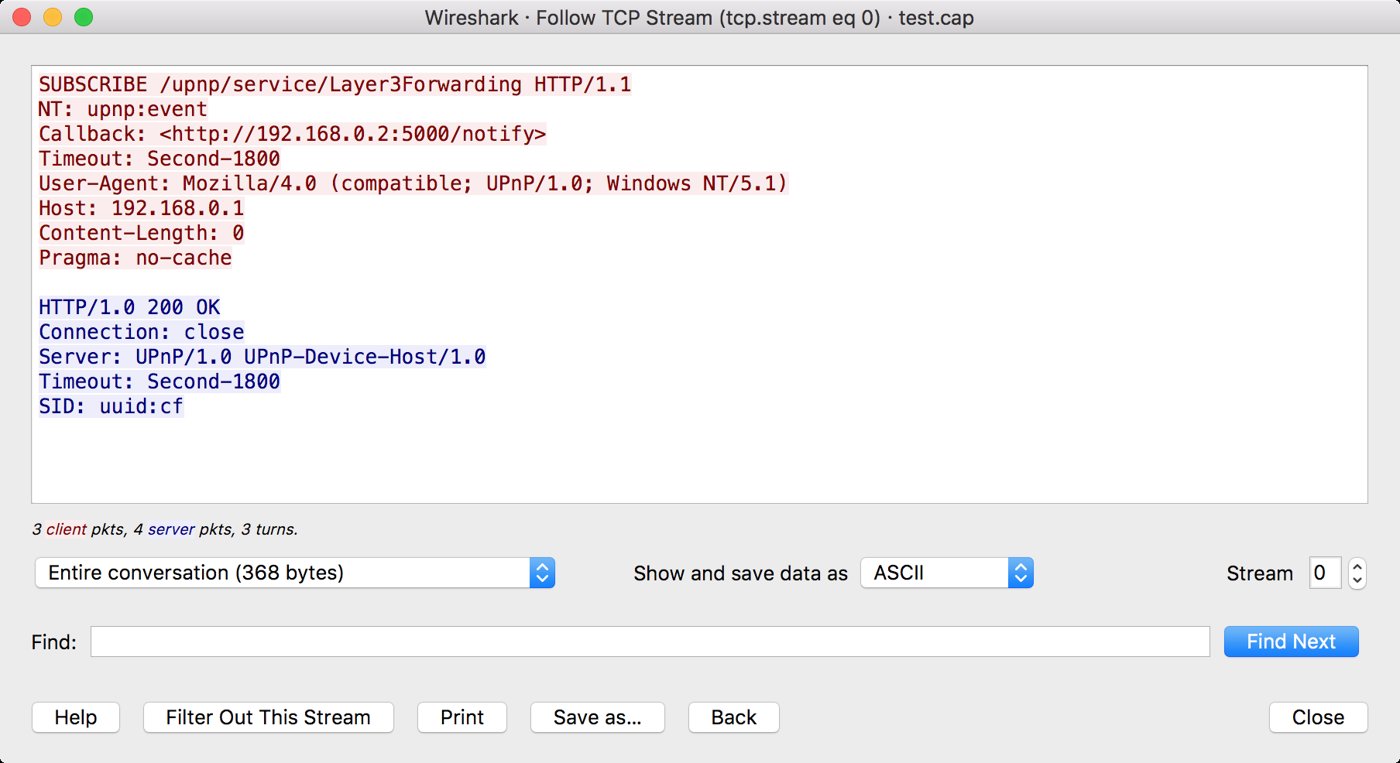
9.3 Follow TCP / UDP / TLS / HTTP / HTTP2 Stream
A single TCP conversation may span hundreds of packets — handshake, multiple HTTP requests, data, FIN exchange. Reading them packet-by-packet is hard. Follow Stream reassembles the payload of a conversation into a single text/binary view.
9.3.1 How to use
- Click any packet in the conversation.
- Right-click → Follow → TCP Stream (or UDP Stream, TLS Stream after decryption, HTTP Stream, HTTP/2 Stream).
- A window opens showing the reassembled payload:
- Client-to-server bytes in red.
- Server-to-client bytes in blue.
- Display formats: ASCII, EBCDIC, Hex Dump, C arrays, Raw, YAML.
The Wireshark filter bar auto-updates to tcp.stream eq N — keeps only this conversation in the packet list.
9.3.2 Use cases
- HTTP request/response: Follow → HTTP Stream → see the full
GET /admin HTTP/1.1→200 OKexchange including all headers and body in plain text. - Extract a file: Follow the conversation that downloaded the file, switch display to “Raw,” click Save as…, save the bytes to disk. Reconstructs the downloaded file (PDF, image, exe).
- Verify cleartext exposure: Follow a Telnet stream and see the password typed on the wire. Useful for the “we don’t allow telnet” assertion that the capture refutes.
- Reconstruct chat: IRC, XMPP, MQTT — Follow TCP Stream shows the conversation as plain text.
9.3.3 Export Objects — the bulk version
For HTTP and a few other protocols, File → Export Objects → HTTP lists every file transferred over HTTP in the capture, with filename, content-type, size. Multi-select → save all to a folder. Much faster than per-stream extraction.
Other protocols supported by Export Objects: HTTP, IMF (email), SMB, TFTP, DICOM.
9.4 Expert info — what Wireshark flags as suspicious
Wireshark’s dissectors emit expert info notes when they see unusual conditions. Counts visible in the bottom-right of the status bar (a colored dot — red = error, yellow = warning, blue = note).
Analyze → Expert Information opens the full list:
- Errors (red): malformed packets, dissector exceptions, “unable to dissect rest of packet.”
- Warnings (yellow): TCP retransmission, duplicate ACK, zero window, port number reuse, SSL alerts.
- Notes (blue): TCP keepalive, segment lost (kernel dropped before capture).
- Chats (light blue): conversational events — connection setup, application protocol events.
Filter on expert info:
expert.severity == "Error"
expert.severity == "Warning"
expert.message contains "retransmission"
For “is this network healthy?” triage, sort the packet list by Expert Info column — outliers float to the top.
9.5 IO graphs and TCP stream graphs
9.5.1 IO graph (the throughput-over-time view)
Statistics → I/O Graph. By default plots packets-per-second over the capture duration. Up to 10 series can be configured, each with its own display filter — useful for “compare HTTP traffic vs DNS traffic over the capture” or “show retransmissions over time.”
Example series:
- Series 1:
tcp— all TCP traffic - Series 2:
tcp.analysis.retransmission— just retransmissions - Series 3:
http— HTTP layer - Series 4:
dns— DNS
Y-axis units: packets, bytes, bits per second/minute/hour. Style: line, bar, stacked, dot. Useful for spotting an exfiltration window or a DoS burst.
9.5.2 TCP Stream Graph
Statistics → TCP Stream Graphs → Throughput / Round Trip Time / Sequence Number Stevens / Window Scaling.
- Throughput: bytes per second for the selected TCP stream — useful for “why is this download slow?”
- Round Trip Time: SRTT estimates over time — visible packet loss as RTT spikes.
- Sequence Number (Stevens): classic time-vs-sequence plot — retransmissions appear as backward jumps, slow start visible as growing window.
- Window Scaling: receive window over time.
9.6 TCP analysis flags — retransmission, out-of-order, zero window
Wireshark’s TCP dissector tags packets with tcp.analysis.* flags. Some matter for performance / debugging:
Table 1 — Wireshark's TCP dissector tags packets with tcp.analysis. flags. Some matter for performance / debugging
| Flag | What it means | Concern level |
|---|---|---|
tcp.analysis.retransmission | Same sequence number sent twice — packet was lost or ACK was lost | Some is normal; sustained high rate = problem |
tcp.analysis.fast_retransmission | Retransmission triggered by 3+ duplicate ACKs | Recovery mechanism working |
tcp.analysis.out_of_order | Packet arrived with lower sequence number than expected | Often reordered by network; not always bad |
tcp.analysis.duplicate_ack | Same ACK number repeated | Receiver telling sender “next packet please” — indicates loss |
tcp.analysis.zero_window | Receiver advertised window = 0 (stop sending) | Receiver overwhelmed |
tcp.analysis.window_full | Sender hit the receiver’s window | Pipe full; receiver-side bottleneck |
tcp.analysis.keep_alive | Empty packet to test connection is still alive | Background noise |
tcp.analysis.lost_segment | Wireshark deduces a missing segment (by sequence-number gaps) | Same root cause as retransmission |
tcp.analysis.spurious_retransmission | Retransmit that turned out to be unneeded | Diagnosis: original packet not actually lost |
Filter combinations for triage:
tcp.analysis.flags             # any TCP-analysis-flag present
tcp.analysis.retransmission and not tcp.analysis.fast_retransmission
tcp.analysis.zero_window or tcp.analysis.window_full
9.7 TLS decryption via SSLKEYLOGFILE
The most important Wireshark trick for modern web debugging. TLS encrypts payload — usually unreadable on the wire. But: if you have the TLS session keys for that handshake (because the browser logged them), Wireshark can decrypt and dissect the entire HTTP-over-TLS conversation.
9.7.1 The SSLKEYLOGFILE environment variable
Firefox, Chrome, Brave, Edge (any Chromium- or NSS-based browser) honors a special environment variable: SSLKEYLOGFILE. When set to a writable file path, the browser logs every TLS session’s key material to that file in NSS Key Log Format (lines like CLIENT_RANDOM <hex> <hex>).
9.7.2 Setting SSLKEYLOGFILE
Linux (Parrot):
# In ~/.zshrc or ~/.bashrc:
export SSLKEYLOGFILE=~/.config/sslkeys.log

# Restart browser. Browse to https sites. The file populates with keys.

ls -l ~/.config/sslkeys.log
cat ~/.config/sslkeys.log | head -3
# CLIENT_RANDOM 1a2b3c... 4d5e6f...Windows:
# System Properties → Advanced → Environment Variables → New
# Name: SSLKEYLOGFILE
# Value: C:\Users\<user>\sslkeys.log
# Apply, restart browser.
Or per-session in a cmd:
set SSLKEYLOGFILE=C:\Users\<user>\sslkeys.log
"C:\Program Files\Mozilla Firefox\firefox.exe"
9.7.3 Configuring Wireshark to use the key log
Wireshark → Edit → Preferences → Protocols → TLS → “(Pre)-Master-Secret log filename” → browse to the SSLKEYLOGFILE path → OK.
Now, in real-time (live capture) or on a saved pcap, TLS traffic for which keys exist in the log will decrypt automatically. The packet list shows HTTP instead of TLS for decrypted streams; Follow → HTTP Stream works.
9.7.4 Caveats
- Only sessions whose keys are in the log decrypt. If the browser was restarted mid-capture and the log lost prior keys, those sessions stay encrypted.
- The log file is highly sensitive. Anyone with the log + the pcap can decrypt all the traffic. Treat it as a credential. Don’t ship it with the pcap to a customer.
- TLS 1.3 decryption works the same way —
CLIENT_RANDOMlines apply. - Mobile browser TLS (Safari on iOS, Chrome on Android) doesn’t honor SSLKEYLOGFILE — different decryption story.
- Server-side decryption: if you have the server’s RSA private key (key-exchange-only), Wireshark can decrypt RSA-key-exchange TLS sessions (Wireshark → Preferences → Protocols → TLS → RSA keys list). This does not work for ECDHE / DHE key exchange (which is the modern default), because ephemeral DH means the private key was never on the wire. SSLKEYLOGFILE is the practical solution for ECDHE.
9.7.5 Worked example
# Terminal A: enable SSLKEYLOGFILE, launch Firefox
export SSLKEYLOGFILE=/tmp/keys.log
firefox &

# Terminal B: capture
sudo dumpcap -i any -f "tcp port 443" -w /tmp/web.pcap

# Browse to https://www.wireshark.org/ in Firefox.

# Terminal A: Ctrl+C the dumpcap when done.

# Open Wireshark, load /tmp/web.pcap.
# Preferences → Protocols → TLS → set Master-Secret log to /tmp/keys.log.
# The TLS packets in the list now show as HTTP. Follow HTTP Stream works.
9.8 WPA / WPA2 / WPA3 decryption
For Wi-Fi monitor-mode captures, the 802.11 data frames are encrypted under the per-session keys derived from the EAPOL 4-way handshake (§ 2.4). Wireshark can decrypt them if you provide:
- The pre-shared key (PSK) — i.e., the Wi-Fi passphrase.
- The captured EAPOL 4-way handshake (so Wireshark can derive the per-session PTK).
- The SSID (Wi-Fi network name).
9.8.1 Configuring decryption
Wireshark → Edit → Preferences → Protocols → IEEE 802.11 → check “Enable decryption” → click Edit… next to “Decryption keys” → Add:
- Key type: wpa-pwd (the friendly form: passphrase + SSID)
- Key:
MyPassphrase:MySSID
(Or use wpa-psk and provide the 256-bit derived PSK directly.)
OK. Now any 802.11 data frame protected by that PSK, whose associated 4-way handshake is in the capture, will decrypt — packet list shows the inner Ethernet/IP/TCP/HTTP instead of opaque encrypted blobs.
9.8.2 WPA3 decryption
WPA3 (SAE, Simultaneous Authentication of Equals) replaces the PSK-derivation logic with a Dragonfly handshake. Wireshark 4.x can decrypt WPA3 traffic if you provide the PSK and capture the SAE exchange + 4-way handshake. Same Decryption keys dialog; key type wpa-pwd works for WPA3 as well.
9.8.3 Worked WPA2 example
# Capture full 4-way handshake on channel 6 for SSID "TestNet"
sudo airmon-ng start wlan0
sudo iw dev wlan0mon set channel 6
sudo dumpcap -i wlan0mon -w /tmp/wpa2.pcap

# Force a client to re-authenticate (so we capture the EAPOL 4-way):
sudo aireplay-ng --deauth 1 -a 00:11:22:33:44:55 wlan0mon
# (00:11:22:33:44:55 = BSSID of TestNet)

# Ctrl+C dumpcap.

# Open /tmp/wpa2.pcap in Wireshark.
# Preferences → Protocols → IEEE 802.11:
#   Enable decryption: yes
#   Decryption keys: wpa-pwd "MyPassphrase:TestNet"
# Apply. Data frames now decrypt to inner traffic.
9.8.4 Capturing handshakes for hashcat
If you don’t have the PSK but want to crack it offline:
# Capture as above. Then extract the EAPOL handshake into a hashcat-readable format:
hcxpcapngtool -o /tmp/handshake.hc22000 /tmp/wpa2.pcap

# Crack with hashcat
hashcat -m 22000 /tmp/handshake.hc22000 /usr/share/wordlists/rockyou.txt
hcxpcapngtool is in parrot-tools-wireless (or apt install hcxtools).
9.9 USB capture analysis
9.9.1 Setup
sudo modprobe usbmon
ls /dev/usbmon*    # one per USB bus
# In Wireshark: capture from usbmon0 (or 1, 2, ...).
Capture starts. Every USB transfer on that bus appears as a packet.
9.9.2 The USB encapsulation
USB capture frames carry:
- URB (USB Request Block) header — bus, device, endpoint, transfer type
- Data payload — the actual bytes transferred
Wireshark dissects common USB device classes (HID, Mass Storage, CDC, Audio, Image).
9.9.3 Filters
usb.bus_id == 1
usb.device_address == 5
usb.endpoint_address == 0x81   # IN endpoint 1
usb.transfer_type == 0x03      # interrupt transfers
usbhid.data                    # HID reports
9.9.4 Use cases
- Reverse-engineering a USB device — capture all I/O during normal operation, study the URBs, write a driver.
- Capturing HID keystrokes for a USB keyboard —
usbhid.datashows the 8-byte HID report (modifier byte + up to 6 keycodes). - Mass storage debugging — see SCSI commands inside USB transfers.
- Firmware update protocol reverse-engineering — capture an OEM updater talking to its hardware over USB; replay the protocol from your own code.
9.10 Monitor-mode 802.11 capture and analysis on Parrot
9.10.1 Setup recap
# Pre-flight: kill processes that interfere
sudo airmon-ng check kill

# Bring up monitor mode
sudo airmon-ng start wlan0
# Output: monitor mode vif enabled on [phy0]wlan0mon

# Set channel
sudo iw dev wlan0mon set channel 6

# Or hop across channels for survey
sudo airodump-ng wlan0mon
9.10.2 What you capture
In monitor mode you see:
- Beacons (every ~100 ms from each visible AP) —
wlan.fc.type_subtype == 0x08 - Probe requests (from clients searching) —
wlan.fc.type_subtype == 0x04 - Probe responses —
wlan.fc.type_subtype == 0x05 - Auth / association —
wlan.fc.type_subtype == 0x0b/0x00/0x01 - Deauth / disassoc —
wlan.fc.type_subtype == 0x0c/0x0a - EAPOL 4-way —
eapol - Encrypted data —
wlan.fc.type_subtype == 0x28(QoS data) — opaque without PSK + handshake - Control frames — RTS, CTS, ACK —
wlan.fc.type == 1
9.10.3 Radiotap header
Captures include a Radiotap prefix with per-frame metadata:
- Channel frequency
- Signal strength (dBm)
- Noise level
- Modulation (MCS index for 802.11n/ac/ax)
- Data rate
Useful for proximity inference and AP-vs-AP signal comparison.
9.10.4 Analysis recipes
# All APs in capture (unique BSSIDs from beacons)
Statistics → WLAN Traffic

# Clients probing for specific SSIDs (probe requests reveal what networks the client has
# in its preferred-network list — useful for spoofing)
wlan.fc.type_subtype == 0x04 and wlan.tag.number == 0

# Deauth attacks against a specific AP
wlan.fc.type_subtype == 0x0c and wlan.addr == aa:bb:cc:dd:ee:ff
9.11 tshark CLI — scripting workflow
tshark is the headless CLI counterpart to the GUI. Used when:
- Capture in remote / headless environments.
- Batch-process many pcap files.
- Generate CSV / JSON for piping into other tools.
9.11.1 Basic capture
# Live capture, print packets as they arrive
tshark -i wlan0

# Capture to file
tshark -i eth0 -w /tmp/cap.pcap

# Capture with BPF filter
tshark -i eth0 -f "tcp port 443" -w /tmp/cap.pcap

# Stop after N packets
tshark -i eth0 -c 100 -w /tmp/cap.pcap
9.11.2 Read pcap + apply display filter
# Read file, apply display filter, print human format
tshark -r /tmp/cap.pcap -Y "http.request"

# Print only specific fields
tshark -r /tmp/cap.pcap -Y "http.request" -T fields \
    -e frame.time -e ip.src -e http.host -e http.request.uri \
    -E header=y -E separator=,

# JSON output
tshark -r /tmp/cap.pcap -T json | jq '.[].layers.http'
9.11.3 Useful one-liners
# Top 10 destination ports
tshark -r cap.pcap -T fields -e tcp.dstport \
    | sort | uniq -c | sort -rn | head -10

# All unique DNS query names
tshark -r cap.pcap -Y "dns.flags.response == 0" \
    -T fields -e dns.qry.name | sort -u

# Extract files via HTTP from a pcap (Export Objects equivalent)
tshark -r cap.pcap --export-objects http,/tmp/extracted/

# Count packets per source IP
tshark -r cap.pcap -T fields -e ip.src \
    | sort | uniq -c | sort -rn | head -20

# Print TLS Server Name Indications
tshark -r cap.pcap -Y "tls.handshake.type == 1" \
    -T fields -e tls.handshake.extensions_server_name | sort -u

# Show TCP retransmissions per stream
tshark -r cap.pcap -Y "tcp.analysis.retransmission" \
    -T fields -e tcp.stream | sort | uniq -c | sort -rn | head -10
9.11.4 Ring buffer capture in tshark
tshark -i eth0 \
    -b filesize:102400 \
    -b files:50 \
    -w /var/log/captures/eng.pcap
9.11.5 Streaming display
tshark -i eth0 -Y "http.request" -T fields -e ip.src -e http.host -e http.request.uri — print every HTTP request live as it happens. Excellent for monitoring during a pentest.
9.12 Cross-OS workflow patterns
The T480 dual-boots Windows + Parrot. Wireshark runs on both. Some patterns where the cross-OS story matters.
9.12.1 Capture on Parrot, analyze on Windows
Parrot has better capture capability (monitor mode, raw sockets, USB capture via usbmon). Windows has better readability for client-side debugging (corporate web app, Office traffic). Capture on Parrot → save .pcapng → copy to Windows → open in Windows Wireshark. The file format is identical.
9.12.2 Capture on Windows, analyze on Parrot
If a test setup is Windows-side (Windows client app talking to Windows server), capture on Windows via Npcap, save .pcapng, copy to Parrot for analysis where the rich CLI toolchain (tshark + jq + bash) is more efficient.
9.12.3 Mount Parrot’s home from Windows (or vice versa)
To skip USB-stick shuffling:
Parrot reads Windows NTFS: Parrot mounts NTFS partitions read-write out of the box. The Windows C: partition is at /dev/nvme0n1p3; mount it:
sudo mkdir -p /mnt/windows
sudo mount -t ntfs-3g /dev/nvme0n1p3 /mnt/windows
ls /mnt/windows/Users/<user>
(Caveat: if Windows hibernated or BitLocker is active and protectors enabled, NTFS-3G may refuse. Disable Fast Startup on Windows side; suspend BitLocker before mounting.)
Windows reads Parrot ext4: Windows 11 doesn’t natively read ext4. Third-party drivers: Ext2Fsd (free, somewhat dated), DiskInternals Linux Reader (free read-only, easy), Paragon ExtFS for Windows (paid). For LUKS-encrypted Linux partitions, none of these work — LUKS is Linux-side encryption that Windows tools can’t decrypt.
Practical: Mount NTFS from Parrot. Don’t try ext4 from Windows; instead, share pcap files via:
- A shared NTFS-formatted partition (small data partition both OSes can write to)
- USB stick
- A cloud sync (Dropbox / OneDrive / Nextcloud)
- SCP from Parrot to a Windows-side SSH server (Windows 11 ships OpenSSH server as an optional feature)
9.12.4 Same pcap on both OSes simultaneously
Pcap files are sharable. Open the same pcap on Parrot + Windows + a third analyst’s macOS Wireshark — they all dissect identically (modulo version differences in dissectors). Useful for distributed-team analysis.
9.12.5 GUI-vs-tshark workflow split
- GUI for exploratory analysis (drilling into specific packets, expert info, IO graphs).
- tshark + scripts for batch processing (extracting fields from many pcaps, generating reports, monitoring live).
Don’t try to do everything in the GUI; tshark + jq + awk is much faster for “give me a list of all unique domains queried in this pcap.”
9.13 Integration with the Hack Tools lineup — HackRF IQ, Flipper exports
9.13.1 HackRF One IQ captures → Wireshark?
HackRF captures IQ samples — raw RF data, not framed packets. Wireshark doesn’t read IQ files directly. The path is:
- Capture IQ with
hackrf_transferor GNU Radio. - Demodulate to packets in GNU Radio (e.g., GFSK → packet decoder).
- Output packets as pcap via the
gr-fooblocks (or viatext2pcapfrom a hex log). - Open the resulting pcap in Wireshark.
For some protocols (BLE, Zigbee, LoRa via gr-lora_sdr) the GNU Radio flowgraphs publish pcap directly. See ../HackRF One/ deep dive Vol 8 (GNU Radio workflow) for the canonical pipeline.
9.13.2 Flipper Zero SubGHz CSV exports
Flipper SubGHz captures are .sub files (Flipper’s own format) and CSV exports (timestamps + bit sequences). These are not pcap — they’re application-layer signal records. No direct Wireshark integration. Treat them as raw bit-strings to decode with Python or rfcat.
9.13.3 Flipper BLE / NFC dumps
Flipper Zero exports .nfc and .ble log files. Not pcap. Wireshark doesn’t open them; for BLE specifically, capture from a USB BLE sniffer (Nordic nRF Sniffer) into a pcap — that is Wireshark-readable. See Vol 11 for the Nordic nRF Sniffer integration.
9.13.4 Bus Pirate / logic analyzer streams
Bus Pirate I²C / SPI / UART captures can be exported as sigrok native files (.sr), which can be converted to pcap-like formats with sigrok-cli. Specialized; covered when needed in the BP6 project’s volumes.
9.13.5 Tcpdump on the HackRF host
When the HackRF One is paired with a Raspberry Pi as a remote receiver, capturing the network traffic between the Pi and the host (over Ethernet or USB) is a Wireshark job. tcpdump -i eth0 -w hackrf-control.pcap on the Pi, scp the file back, open in Wireshark.
9.14 Gotchas worth knowing
A list of things that bite people repeatedly.
Table 2 — 14. Gotchas worth knowing {#gotchas}
| Gotcha | Symptom | Fix |
|---|---|---|
| Capture filter syntax used in display filter (or vice versa) | “Filter is invalid” / nothing matches | BPF in capture, Wireshark syntax in display. tcp port 80 vs tcp.port == 80. |
| Promiscuous mode disabled by default on some setups | Only see frames addressed to your MAC | Wireshark → Capture → Options → “Enable promiscuous mode on all interfaces.” Mac/wireless may still need monitor mode. |
| dumpcap kernel-drops | Status bar shows “Dropped: N” growing | Capture rate exceeds processing rate. Use ring buffer, narrower capture filter, faster disk. |
| NetworkManager fights monitor mode | Wi-Fi keeps re-associating | sudo airmon-ng check kill before starting monitor mode. |
| TLS decryption configured but no decrypt | TLS still shows encrypted | Verify SSLKEYLOGFILE actually populated (ls -l the file); verify Wireshark preference path correct; verify the specific session’s keys are in the log (the file is append-only; old captures need old keys). |
| WPA2 decryption configured but no decrypt | Data frames stay encrypted | Confirm capture includes ALL 4 EAPOL handshake frames for that session; PSK format passphrase:SSID. |
| Capture too slow on USB Wi-Fi | Packets dropped, signal complaints | Use a USB3 port (not USB2); ensure the dongle’s driver supports the channel; reduce capture rate via channel-narrow filter. |
| pcap vs pcapng confusion | Old tools won’t open pcapng | editcap -F pcap in.pcapng out.pcap converts. |
| Wireshark doesn’t see USB devices | usbmon shows but no traffic | Some kernels gate usbmon; sudo chmod 644 /dev/usbmon* if permissions are off. |
| Time-zone confusion in timestamps | Times look wrong | View → Time Display Format → choose UTC vs local. The PCAP timestamps are UTC; display layer translates. |
| ”Lost segment” notes on a high-quality link | Wireshark thinks packets are lost; they aren’t | Capture point dropped them. Reduce capture rate; check dropped counter. |
| HTTPS traffic shows as “TCP” instead of “TLS” | Dissector confusion | Right-click packet → Decode As → TLS for the relevant port. |
| IP fragments show as separate packets | Hard to follow streams | Edit → Preferences → Protocols → IPv4 → “Reassemble fragmented IPv4 datagrams” on. |
| HTTP requests look truncated | Packet snaplen too short | Capture again with -s 0 (full packets, default in modern dumpcap). |
| GUI freezes on a 10 GB pcap | All packets loaded into RAM | Use tshark + filters; or use Wireshark with -Y filter set at open time; or editcap -c to slice first. |
| Time-precision warning in capture | Pcap is microsecond, pcapng is nanosecond | Usually harmless; only matters if you need ns-precision. |
| Mixed-case in display filters fails | IP.SRC == 10.0.0.5 doesn’t work | Field names are case-sensitive lowercase. |
ssl. filter prefix no longer works | Old tutorials say ssl.handshake; modern Wireshark uses tls. | Update to tls.handshake. |
| ”This protocol is undecoded” on standard ports | Dissector disabled in Enabled Protocols | Analyze → Enabled Protocols → re-check. |
9.15 Cheatsheet additions
- Follow stream: right-click packet → Follow → TCP/UDP/TLS/HTTP/HTTP2 Stream.
- Export HTTP objects: File → Export Objects → HTTP.
- TLS decryption: set
SSLKEYLOGFILE=path→ restart browser → in Wireshark Preferences → Protocols → TLS → set master-secret log path. - WPA2 decryption: Wireshark Preferences → Protocols → IEEE 802.11 → enable decryption → add
wpa-pwdkeypassphrase:SSID→ ensure full 4-way handshake is in capture. - USB capture Linux:
sudo modprobe usbmon→ capture from usbmonN. - Monitor mode Parrot:
sudo airmon-ng check kill && sudo airmon-ng start wlan0→ capture from wlan0mon. - tshark print fields:
tshark -r cap.pcap -Y "filter" -T fields -e field1 -e field2 -E header=y -E separator=,. - tshark JSON:
tshark -r cap.pcap -T json. - tshark extract files:
tshark -r cap.pcap --export-objects http,/tmp/extracted/. - Hashcat-format WPA handshake:
hcxpcapngtool -o handshake.hc22000 cap.pcap. - Crack WPA handshake:
hashcat -m 22000 handshake.hc22000 rockyou.txt. - Top destination ports:
tshark -r cap.pcap -T fields -e tcp.dstport | sort | uniq -c | sort -rn | head. - Unique TLS SNIs:
tshark -r cap.pcap -Y "tls.handshake.type == 1" -T fields -e tls.handshake.extensions_server_name | sort -u. - Cross-OS: pcapng is portable between Windows / macOS / Linux Wireshark; key log file (SSLKEYLOGFILE) is portable too.
Comments (0)